

Slate
Helping Investigators connect the dots
Overview
Slate was the minimum viable product (MVP) for in8development, an early-stage startup I co-founded to explore a new approach to investigative and case-management software. Built as a native Windows application, Slate enabled investigators to import evidence, visually organize complex cases, and generate reports within a single, cohesive workflow. The product emphasized clarity and flexibility, adapting to real investigative workflows rather than forcing users into rigid structures. This work required rapidly building domain understanding and designing for nuanced, real-world investigative processes.
While the company did not ultimately reach market, the work reflects my ability to enter unfamiliar domains, lead 0→1 product development, and apply design best practices in high-complexity environments. The vision helped raise approximately ~$1.5M in funding and resulted in a granted patent for the core interaction model, which I am a co-inventor on.
The Problem
Investigators and financial forensics teams relied on tools that were poorly suited to how real cases unfold. Solutions in this space tended to fall into two extremes: massive, all-encompassing enterprise platforms that were complex, expensive, and slow to adapt, or homegrown in-house tools that were brittle, inconsistent, and difficult to scale.
Neither approach served the needs of small and mid-sized organizations such as local law enforcement agencies and financial institutions, who needed flexible, intuitive tools to manage complex investigations without the overhead of enterprise systems. Existing tools also did a poor job of supporting how evidence, relationships, and timelines are explored and understood in practice, forcing teams into workflows that worked against how investigations actually happen.
My Role
Led end-to-end product design across research, UX, interaction, and visual design.
Served as product manager, defining product strategy, feature priorities, and development specifications.
Balanced user needs, technical constraints, and business goals from concept through MVP delivery.
The (potential) Users
The product was designed in close collaboration with four federal special agents working complex financial crime investigations. I partnered directly with these subject matter experts to understand real investigative workflows, pain points, and limitations of existing tools.
To broaden perspective beyond federal use cases, I also worked with the Park City Police Department and interviewed certified fraud examiners, who represented key segments of the initial target market. These additional perspectives helped validate the product across a wider range of investigative contexts and organizational scales.
“Aryk is an accountable and hardworking teammate, demonstrating a willingness to own the design from user research and low-fidelity mock-ups to prototyping, visual design, usability testing, and iteration. ”
SELECTED DESIGNS
The following research and designs illustrate the problems we were working to solve and what a potential solution could look like. This work reflects my approach to 0→1 product design, rapid domain immersion, and shaping complex systems in unfamiliar problem spaces. The concepts shown here demonstrate how I moved from ambiguity to concrete product direction while balancing user needs, technical constraints, and business realities.
The Canvas
The Canvas was the primary workspace within Slate, functioning as an open, freeform environment where investigators could visually organize and reason through complex cases. Drawing on interaction patterns from collaborative digital whiteboards and visual workspaces, the Canvas allowed users to freely arrange and connect information. Unlike general-purpose whiteboarding tools, it was purpose-built for investigative work, preserving context, rationale, and evolving understanding behind relationships as cases developed.
To inform the design of the Canvas, I facilitated working sessions with federal special agents to observe their workflows and better understand the challenges they faced and how investigations actually unfold. These sessions focused on how evidence is collected, compared, grouped, and revisited over time. The research led to multiple proposed approaches for canvas layout, interaction models, and card styles, all grounded in how investigators naturally externalize and organize information.
Notes from user interviews on building an interactive workspace
Rough sketches of canvas concepts during initial interviews
The Problem
The challenge was to replace a mix of physical and digital tools, including whiteboards, string boards, and complex Visio-style diagrams, with a single, flexible workspace. Investigators needed to spatially organize large volumes of evidence while also qualifying and validating the relationships between items. Given that investigations could involve thousands of objects, each element needed to convey meaning beyond a simple icon and remain usable at scale.
The Solution
Through user interviews and A/B testing, I determined that a card-based representation provided the right balance of flexibility and information density. Each object appeared as a movable card on the canvas, allowing users to cluster, group, and relate items spatially. Relationships were created directly through interaction, and when additional context or metadata was required, the system guided users through a focused workflow.
The Canvas supported zooming and panning to let users move fluidly between high-level structure and detailed analysis, similar to modern collaborative canvases. This approach allowed investigators to externalize their thinking, explore connections, and maintain confidence in the integrity of their work as cases evolved.
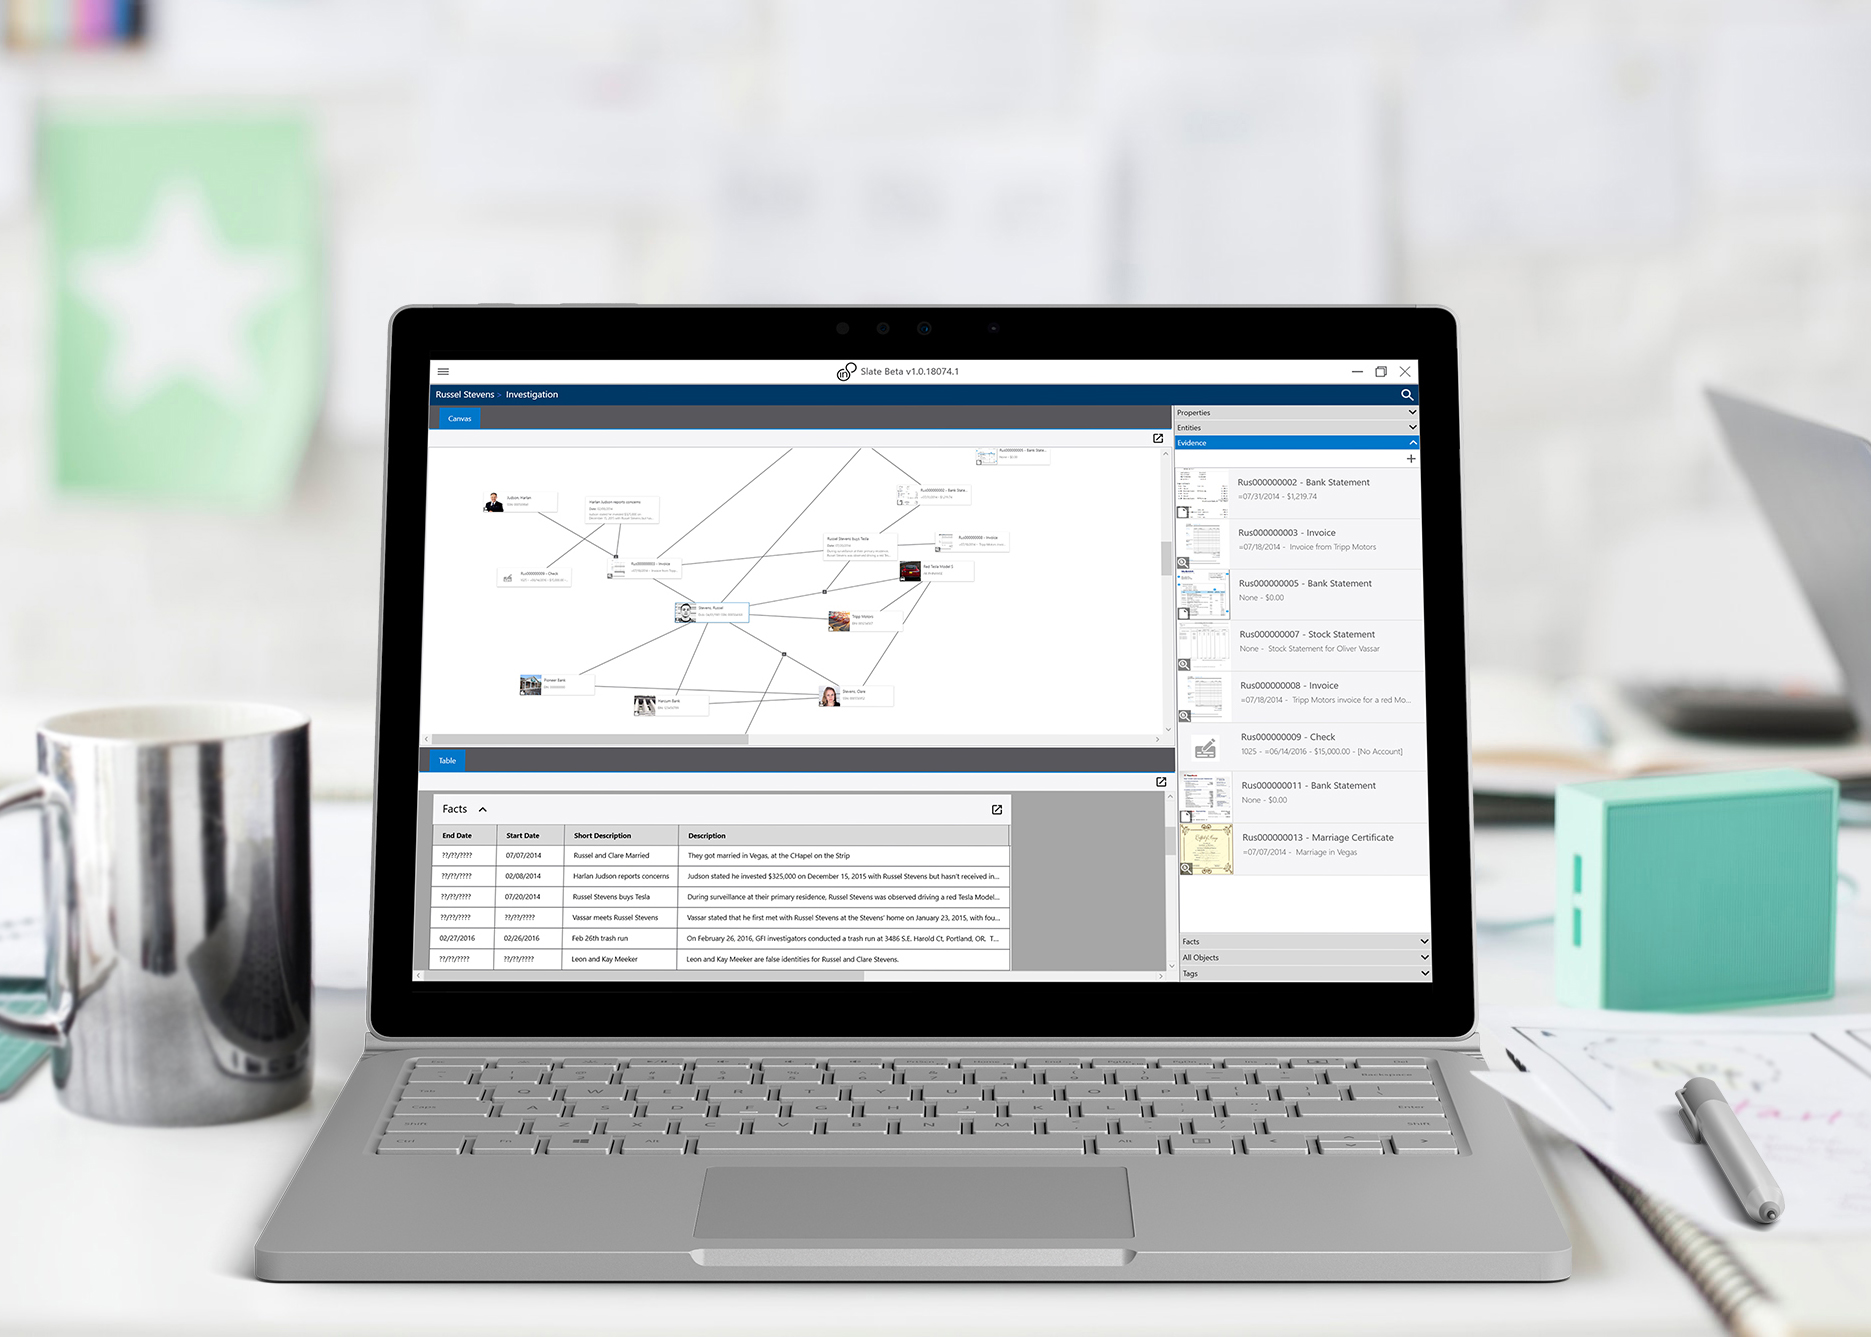
A sample case in the Canvas
“FUZZY” DATE Picker
The “fuzzy” date picker was a custom date and time input I designed for Slate to support how investigators actually describe events. Rather than forcing artificial precision, the component allowed users to capture approximate, uncertain, or evolving temporal information using the language and qualifiers common in investigative work. This interaction model was novel enough to be included in the product’s granted patent, reflecting its role as a core innovation rather than a standard UI control.
The Problem
Investigative work frequently relies on imprecise temporal language. Users needed to capture information such as “on or about noon,” “sometime in June,” or “before the end of 2026” without losing meaning or introducing false precision. Traditional date and time pickers assume certainty and exactness, making them poorly suited for investigative workflows where details are often incomplete, uncertain, or refined over time.
The Solution
I explored variations on traditional date and time pickers and extended them to support qualifiers and degrees of certainty. The final design allowed users to apply contextual modifiers such as “on or about” “before” or “unknown” while still capturing as much structure as possible. When specific values weren’t known, the interface supported intentionally vague or placeholder inputs rather than forcing users to guess.
A persistent, human-readable readout provided immediate feedback, reflecting the combined date, time, qualifiers, and time zone in plain language. This helped users understand exactly what had been recorded, reinforcing confidence and accuracy while preserving the flexibility required for investigative work.
The Fuzzy Date Picker
Alternate Data Views
The Timeline view translated the open-ended flexibility of the Canvas into a chronological format. Users could view events as a single unified timeline or compare activity across multiple timelines using swimlanes. Rather than showing isolated events, this view preserved investigative context, making it easier to see when things happened, how they were connected, and what else was unfolding at the same time.
The Problem
Existing timeline tools used by investigators were static and manual. Tools like Visio required timelines to be built and maintained by hand, duplicating work already captured elsewhere in the case. As investigations evolved, timelines quickly became outdated, disconnected from underlying evidence, and difficult to compare across related events or suspects.
The Solution
Through iterative design exploration and testing, I focused on two capabilities that significantly expanded the value of the Timeline view. First, the timeline surfaced related objects alongside primary events, allowing agents to see people, assets, and transactions in context rather than as isolated moments in time. Second, the interface supported multiple timelines within a single view, enabling side-by-side comparison across suspects, accounts, or parallel investigative threads.
The Timeline stayed fully synchronized with the Canvas. Updates to evidence or relationships were immediately reflected across views, removing redundant work and keeping information consistent. The result was a dynamic, context-rich timeline that supported pattern recognition and meaningful comparison as investigations evolved.
The Timeline View
The Swimlane View